Dental Insurance Statistics: Access Disparities & Costs | USA Data
Reader-supported. We may earn a commission from links on this page. Advertising disclosure.
In this article
Dental insurance has become a mainstay in benefits packages and an essential consideration for many families and individuals. Yet, while millions of Americans have some form of dental coverage, gaps in coverage and disparities across different regions and income levels persist.
The following sections cover the major trends and data points surrounding dental insurance coverage in the United States, including how prevalent coverage is today, key demographic and geographic differences, and the most important statistics that illuminate the state of dental benefits.
Broader Overview of Dental Insurance Coverage
Dental insurance plans, especially employer-sponsored ones, have grown steadily in popularity over the last decade. Unlike medical insurance, which is widely regarded as a financial safeguard against catastrophic costs, dental coverage has traditionally been focused on preventive and basic treatments.
However, broader plan designs are emerging, with a notable emphasis on covering major services such as crowns, implants, and orthodontics, even if only partially.
At the same time, certain challenges remain. People without access to employer plans often have to choose between individual policies with waiting periods and relatively low annual benefit caps.
Income and geography also play major roles in determining who has coverage and who doesn’t. For policymakers, employers, and individuals alike, understanding these trends is critical to improving access to oral care.
Key Statistics at a Glance
- Coverage Prevalence: Approximately 87% to 88% of Americans now have some form of dental insurance, up significantly from a decade ago.
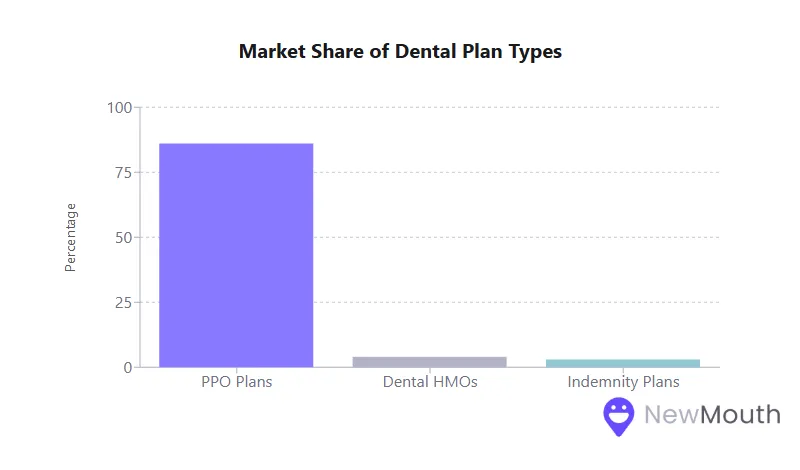
- Dominant Plan Type: Preferred Provider Organization (PPO) plans account for roughly 80% to 90% of the private dental insurance market.
- Employer Sponsorship: About 91% of those with private dental benefits obtain coverage through an employer or group plan.
- Preventive Emphasis: Preventive and diagnostic services constitute 75% of dental procedures performed, reflecting a shift toward proactive oral care.
The Rise in Dental Insurance Coverage
Dental insurance coverage has expanded considerably over the past 5 to 10 years. A combination of employer-sponsored plans, public coverage (e.g., Medicaid expansion for children and, in some states, adults), and increased offerings for seniors has pushed coverage rates to historic highs.
- Overall Insured Rate
- Approximately 88% of the U.S. population was estimated to have dental benefits at the end of 2022.
- As pandemic-era Medicaid enrollments unwound in 2023, coverage dipped slightly to ~87%.
- PPO Dominance
- Around 86% to 89% of private dental plan enrollees are in PPO-type plans.
- Dental HMOs and indemnity plans comprise a much smaller share of the market (4% to 3%, respectively).
Having more people covered has fueled a rise in preventive dental care utilization. Regular exams and cleanings are more commonly accessed with insurance, helping to reduce the need for costly procedures later on.
Premium Costs and Affordability
Dental insurance premiums are notably stable, especially compared to medical insurance rates, which have climbed more sharply in recent years. This stability is part of what makes dental coverage such a valued benefit for employees and individuals alike.
- Annual Premium Increases
- Premiums for dental plans have increased by only 1% to 2% annually in many recent reporting periods.
- This rate of increase often falls below general inflation levels.
- Typical Monthly Premiums
- Employer-Sponsored Plans: Often cost $20 to $30 per month per employee (or less) when partially subsidized by the employer.
- Individual Policies: Generally, $20 to $50 per month for single coverage, with family plans falling in the $50 to $150 monthly range.
- Voluntary vs. Employer-Paid
- A growing number of employer dental plans (43% in one recent analysis) are offered as voluntary coverage, meaning employees pay the full cost.
- Despite the move to voluntary offerings, participation rates can still be high when group rates are competitive.
Because dental plan benefits are more limited than those of medical insurance, particularly due to annual maximums, carriers can keep premiums relatively low. While that can make coverage more accessible, it does mean you shoulder greater out-of-pocket costs when extensive dental work is needed.
Utilization Patterns and Preventive Focus
Why the Data Matters
Understanding how people use their dental benefits can reveal whether insurance effectively improves oral health. Recent data shows that coverage has a clear effect on how frequently people seek dental care.
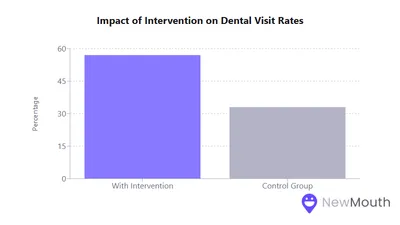
- Higher Utilization Among the Insured
- Individuals with dental benefits are roughly twice as likely to visit a dentist annually compared to those without coverage.
- Many enrollees receive two or more visits per year, thanks in part to fully covered preventive services.
- Shift Toward Preventive Services
- 75% of all dental procedures performed are now diagnostic or preventive, up from about 64% two decades ago.
- Major procedures (like crowns, root canals, or extractions) have declined as a share of total treatments, suggesting that routine care is reducing the need for invasive services.
- Overall Out-of-Pocket Spending
- Even with insurance, about one-third of dental spending is paid directly by patients (coinsurance, deductibles, or costs above annual maximums).
- This reflects the typical coverage structure of 100% for preventive, around 80% for basic, and 50% for major services.
By providing immediate, no-cost preventive care (like cleanings and exams), most plans encourage proactive oral health, which can stave off extensive restorative needs later.
Provider Networks and Access to Care
Why the Data Matters
Large provider networks make it easier for insured individuals to use their benefits, but in rural or underserved regions, a shortage of dentists can pose significant challenges.
- Network Adequacy in Urban vs. Rural
- Urban and suburban areas typically have strong in-network options, with most dentists contracting with multiple dental plans.
- Rural areas often face dentist shortages, sometimes leaving few or no in-network providers within a feasible distance.
- Employer Satisfaction
- A large majority of employers report adequate access to in-network general dentists for their employees.
- Issues primarily arise around specialty care (pediatric specialists, oral surgeons) or in less populated regions.
Despite the broad acceptance of major PPO networks in densely populated markets, addressing network adequacy in rural zones remains a policy and industry concern.
Some states are tightening geographic access standards to ensure people can find an in-network provider within a set radius or driving time.
Out-of-Pocket Expenses and Annual Maximums
Dental insurance often has lower deductibles and fewer visit copays compared to medical plans but relies heavily on an annual maximum that caps what the insurer pays each year.
- Typical Plan Design
- $50 individual deductible (waived for preventive services)
- 100-80-50 Coverage (preventive-basic-major)
- Annual Maximum of $1,000 to $2,000 per enrollee
- Impact of the Annual Maximum
- Only about 5% of insured patients reach their annual maximum, typically those needing extensive procedures like implants or multiple crowns.
- Once the max is met, all additional costs revert to the patient.
- Some newer plans offer “rollover” features or exclude preventive care from counting against the maximum to reduce financial barriers.
In practice, the annual maximum means dental coverage remains modest for catastrophic-level dental needs. This differs starkly from medical insurance, which usually includes an out-of-pocket maximum rather than a cap on insurer payments.
Employer-Sponsored Plans: Offer Rates and Trends
Why the Data Matters
Employers are the most common source of private dental benefits, making workplace offerings central to overall coverage statistics.
- Growing Prevalence
- Over 90% of firms that provide health insurance also include a dental plan option.
- Large corporations (200+ employees) nearly universally offer dental benefits, while mid-size and smaller businesses also show increasing adoption.
- Employee Take-Up
- Participation can reach 80% to 90% where the employer subsidizes a portion of the dental premium.
- Even voluntary (100% employee-paid) plans retain a decent enrollment, showing that workers recognize the value of discounted group rates.
- Employer Cost-Sharing
- Employers may cover half or more of the premium for employees, though cost-shifting to employees has increased in recent years.
- Many businesses see dental as an affordable perk that enhances overall benefits packages and helps attract/retain talent.
Since so many working adults gain coverage through their employers, the design and generosity of these plans significantly shape national dental utilization and spending patterns.
The Individual Dental Insurance Market
While employer plans dominate, the individual market for dental coverage has also expanded to meet the needs of retirees, self-employed workers, and anyone without job-based benefits.
- Market Share
- Only 5% to 10% of private dental coverage is purchased individually rather than through a group.
- This relatively small share contributes to persistent coverage gaps among lower-income adults or part-time workers.
- Waiting Periods
- Most individual plans enforce waiting periods (6 months for basic, 12 months for major services) to deter immediate, high-cost claimants.
- This often discourages people from enrolling right when urgent dental needs arise unless they can delay treatment.
- Senior Coverage
- Medicare does not typically include routine dental care, pushing many older adults to either buy a standalone plan or choose a Medicare Advantage plan with embedded dental.
- Only about half of Americans over 65 have any dental coverage, creating a notable coverage gap for seniors.
Without the economies of scale and employer cost-sharing, individual dental coverage tends to provide weaker benefits at higher monthly costs, underscoring the importance of expanding employer-sponsored and public programs.
Income Disparities and Coverage Gaps
Why the Data Matters
Income strongly correlates with access to dental insurance, reflecting inequities in both employment-based coverage and state Medicaid policies.
- Low-Income Gaps
- Lower-income adults are far more likely to be uninsured for dental, particularly in jobs without benefits.
- Many rely on Medicaid, but adult dental benefits vary widely by state; some states cover only emergency extractions, while others offer broader coverage.
- Senior Disparities
- Among seniors below the poverty line, fewer than 1 in 10 have private dental benefits.
- Higher-income seniors, by contrast, often maintain employer retiree plans or purchase individual coverage.
- Geographic Variations
- States that provide strong Medicaid dental coverage for adults see broader population coverage, while states offering minimal or no adult Medicaid dental have higher uninsured rates.
- Rural and economically disadvantaged regions face an amplified lack of insured dental access.
These disparities in coverage contribute to significant oral health inequities. Individuals who can’t afford preventive and routine care often end up seeking emergency treatment or forgoing treatment altogether.
How Location Influences Coverage and Access
Beyond state-level Medicaid policies, an area’s economic profile, local employer base, and the density of dental providers all factor into dental coverage trends.
- Urban vs. Rural
- Urban centers typically enjoy multiple in-network providers and higher employer-based insurance uptake.
- Rural areas often have fewer dentists and more uninsured residents, with some counties designated as Dental Health Professional Shortage Areas.
- State-by-State Differences
- Northeastern states and parts of the West Coast tend to report higher rates of insured individuals, partly thanks to stronger Medicaid programs and generous employer offerings.
- Southern states with minimal adult Medicaid dental coverage tend to lag behind, although expansions in places like Kentucky have made significant inroads.
Policy measures aiming to improve rural access, like tele-dentistry and loan repayment incentives for dentists, remain critical to expanding functional coverage beyond just having a dental plan on paper.
Covered vs. Excluded Procedures
Dental insurance typically provides strong coverage for the most common services, but many plans exclude or limit higher-cost, more specialized treatments.
- Standard Coverage
- Class I (Preventive): Cleanings, exams, basic X-rays at 100%
- Class II (Basic Restorative): Fillings, simple extractions, often 70% to 80% covered
- Class III (Major Restorative): Crowns, dentures, bridges, usually 50% coverage
- Common Exclusions and Limits
- Annual or Lifetime Maximums for orthodontics (often $1,000 to $2,000)
- Waiting periods for major work in individual plans
- Cosmetic treatments like teeth whitening or veneers typically excluded
- Alternate benefit clauses (insurer covers the least expensive acceptable procedure)
Coverage variability, particularly for implants, adult orthodontics, and advanced oral surgery, often leads to confusion or dissatisfaction if you expect more generous benefits.
The Effect of Annual Maximums on Accessibility
Why the Data Matters
Dental plans use annual maximums to control costs, but this design can leave patients unprotected from substantial expenses. This is in direct contrast to how medical insurance caps patient costs rather than insurer payouts.
- Common Max Ranges
- $1,000 to $2,000 per person per year remains standard.
- Though some employers negotiate higher max options (e.g., $2,500), it’s still insufficient to cover multiple major treatments in a single year.
- Who Hits the Max?
- Only around 5% of plan enrollees exhaust their annual maximum.
- Those who do often delay further procedures until the next benefit year, risking worsened dental conditions if care is urgent.
- Innovations
- Rollover provisions allow unused benefits to accumulate.
- Some plans exclude preventive care from counting toward the maximum, preserving coverage for restorative needs.
While annual caps help keep premiums low, it also means dental insurance stops providing financial support once significant treatment costs arise. This structural limitation remains a top consumer concern.
Waiting Periods and Their Impact on Utilization
Why the Data Matters
Waiting periods in dental plans can delay care for new enrollees and represent a key distinction between group vs. individual coverage.
- Typical Durations
- 6 months for basic services
- 12 months for major procedures
- Behavioral Effects
- Patients needing immediate care may either pay entirely out-of-pocket or put off treatment.
- Some wait to enroll until they sense a looming need, only to find the waiting period blocks timely coverage.
Although waiting periods help insurers avoid losses from individuals who enroll solely for expensive procedures, they can also inadvertently discourage early intervention for potential dental problems.
Emphasis on Preventive Coverage
Preventive and diagnostic services are almost always fully covered, often without counting against the annual maximum, to promote consistent oral health maintenance.
- Core Preventive Services
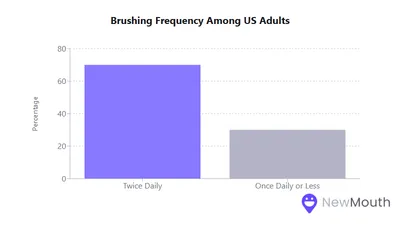
- Twice-yearly exams and cleanings
- Routine X-rays
- Fluoride and sealants for children
- High Utilization
- Plans covering preventive at 100% have driven increased exam and cleaning rates.
- Some carriers now offer extra cleanings for pregnant women or individuals with conditions like diabetes or heart disease.
This broad first-dollar coverage for preventive care is a success story in dental insurance. It helps shift utilization toward regular checkups and away from crisis-driven treatments.
Insurer vs. Consumer Cost-Sharing
Under typical dental plan structures:
- Preventive is 100% insurer-paid.
- Basic Restorative sees 70% to 80% from the insurer and 20% to 30% from the patient.
- Major Restorative splits often land at 50% to 50%.
Nationally, private dental insurance covers nearly half of all dental spending, while out-of-pocket payments still account for about one-third. Despite being called “insurance,” the reality is that dental coverage is often more of a cost-sharing mechanism with limited protection against very high-cost treatments.
Consumer Satisfaction and Common Concerns
Most enrollees express overall satisfaction with dental coverage, citing affordability and free preventive care. Still, a few issues routinely arise:
- Annual Maximums: Patients who need multiple crowns or implants may hit their max quickly.
- Exclusions/Waiting Periods: Individual plan members can be caught off guard by major work not covered until after a waiting period.
- Network Gaps: In rural areas, a plan may have few participating dentists nearby, undermining coverage value.
- Claims Denials: Often tied to frequency limits or alternative treatment clauses, can cause frustration if not explained clearly.
Despite these complaints, recent surveys show rising satisfaction scores as insurers improve transparency and coverage communication.
These statistics underscore how central dental insurance has become for facilitating access to preventive care and basic treatments. Yet it also remains limited in important ways. Most plans still impose annual maximums, waiting periods, and coverage exclusions that can leave you with significant out-of-pocket costs for advanced procedures.
For employers, offering dental benefits is a relatively affordable way to promote overall health, employee satisfaction, and retention. Meanwhile, public initiatives to broaden coverage, especially for low-income adults and seniors, can address longstanding inequities in oral health access.
Ultimately, dental insurance works best as part of a proactive approach, steering individuals toward regular checkups while sharing the cost burden of more extensive services. Continued innovations in plan design, along with policy measures that close coverage gaps, have the potential to improve the oral health landscape for everyone.
Sources
- American Dental Association (ADA) – https://www.ada.org/resources/practice/dental-insurance/dental-benefit-trends
- Business Wire – https://www.businesswire.com/news/home/20230613077406/en/Dental-Plan-Satisfaction-Rising-as-Communications-and-Plan-Coverage-Increase-J.D.-Power-Finds
- Centers for Disease Control and Prevention (CDC) – https://www.cdc.gov/nchs/products/databriefs/db337.htm
- Humana – https://www.humana.com/dental-insurance/dental-resources/how-much-is-dental-insurance
- KFF (Kaiser Family Foundation) – https://www.kff.org/health-costs/press-release/benchmark-survey-annual-family-premiums-for-employer-coverage-rise-7-to-nearly-24000-in-2023/
- National Association of Dental Plans (NADP) – https://www.nadp.org/nadp-report-reveals-overall-decrease-in-dental-benefits-enrollment/

Web content writer specializing in making dental research accessible to diverse audiences.
Related Articles

Best Foods for Healthy Teeth and Gums
What you eat plays a crucial role in maintaining a healthy mouth, and below we cover the best foods to incorporate into...

Home Remedies for Removing Plaque and Tartar
Plaque and tartar are the unwelcome guests that threaten the health of our smiles. Home remedies can complement your dai...
Oral Hygiene Practices Around the World
Oral hygiene practices are vital to maintaining healthy teeth and gums, yet brushing and flossing habits vary widely by...
Statistics on Oral Health Among Pregnant Women
Maintaining good oral health during pregnancy is often overlooked, yet it is a crucial component of prenatal care. Hormo...